ECE 4750 Section 3: RTL Testing with Verilator
- Author: Cecilio C. Tamarit
- Date: September 7, 2023
- Inspired by previous ECE 4750 material
Table of Contents
- VCD format and waveform visualization in VSCode
- Overview of Testing Strategies
- (Review: Testing with Stream Sources and Sinks)
- Generating Coverage Reports with gcov/lcov
This discussion section serves as a gentle introduction to the basics of RTL testing using Verilator and gcov/lcov.
Start by logging into the ecelinux servers using the remote access option
of your choice and then source the setup script. We can then reuse the
setup from last week. Make sure you make clean if your directory from last
week already exists:
Make sure you make clean if your directory from last week already exists:
% cd $HOME/ece4750/sec/sec02
% make clean
If it doesn’t exist, we can set it up again:
% source setup-ece4750.sh
% mkdir -p $HOME/ece4750/sec
% cd $HOME/ece4750/sec
% TOPDIR=$PWD
% wget https://github.com/cornell-ece4750/ece4750-sec02-verilog/raw/m3/docs/sec02.tar.gz
% tar xvf sec02.tar.gz
% rm sec02.tar.gz
% make setup
% cd $TOPDIR/sec02
Pro tip: VCD format and waveform visualization in VSCode
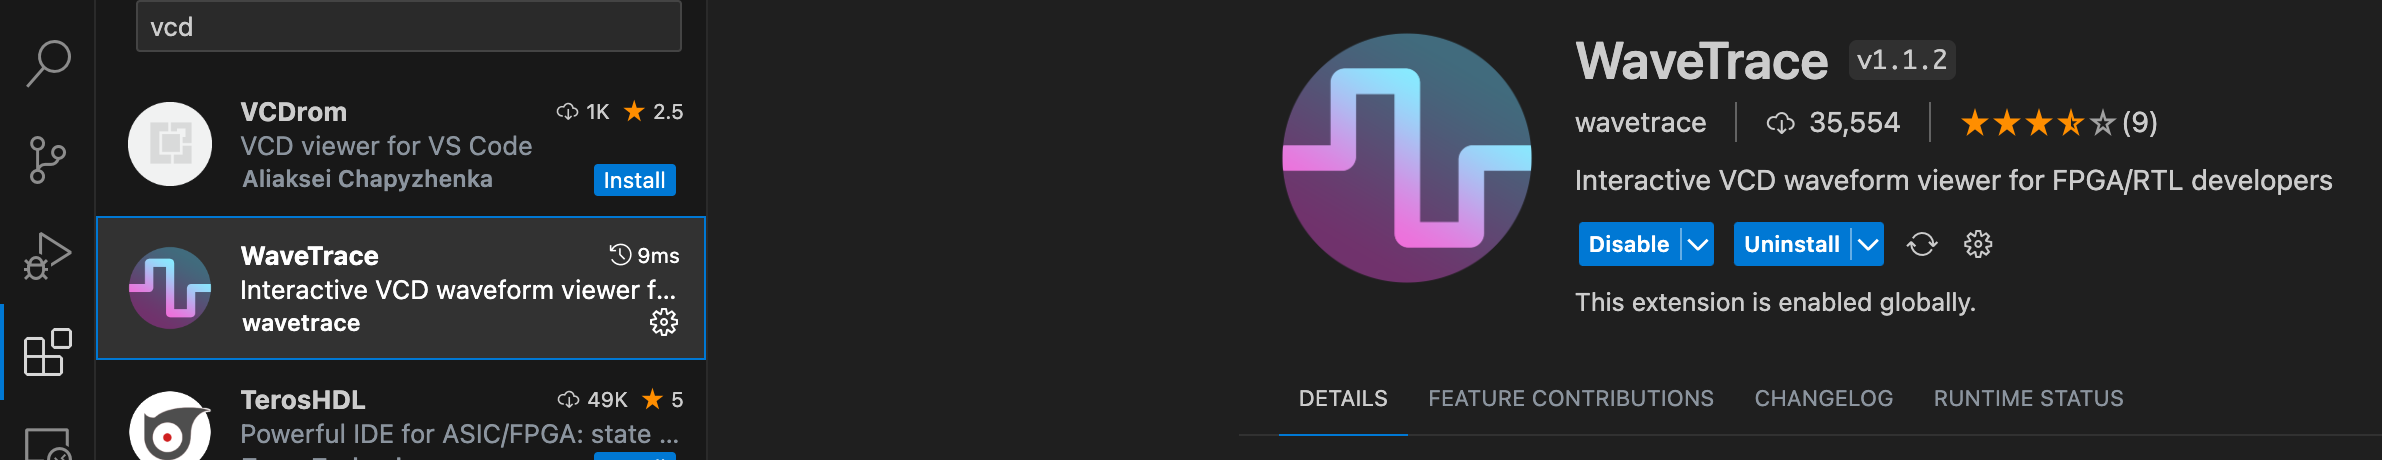
While GTKWave suits the needs of this class, VSCode users will benefit from storing waveforms in the VCD format (as opposed to FST). Several VCD visualization plug-ins exist and can be installed right from VSCode, such as the one shown below. This circumvents the need to resort to X11 or X2Go.
However, we still need to modify $TOPDIR/sec02/verilator.cpp
so that we generate VCD files instead of FST files in the waves
folder. First, by including the right header at the top:
...
#include "verilated_vcd_c.h"
...
Then, by modifying lines ~77-92 as follows to make use of the VerilatedVcdC class:
Verilated::debug(0);
Verilated::randReset(2);
Verilated::traceEverOn(true);
Verilated::commandArgs(argc, argv);
Verilated::mkdir("logs");
const std::unique_ptr<VerilatedContext> contextp{new VerilatedContext};
Verilated::traceEverOn(true);
Vtop* top = new Vtop{contextp.get(), "TOP"};  // Or use a const unique_ptr, or the VL_UNIQUE_PTR wrapper
  //svSetScope (svGetScopeFromName("Vtop.v"));
VerilatedVcdC* tfp = new VerilatedVcdC;
Verilated::traceEverOn(true);
if(waves){
    top->trace(tfp, 99);  // Trace 99 levels of hierarchy
    Verilated::mkdir("waves");
    tfp->open((std::string("waves/")+outname +"waves.vcd").c_str());
}
Lastly, defying course policy, edit the Makefile at
$TOPDIR/sec02/Makefile so that line 88 becomes:
VERILATOR_FLAGS += --trace
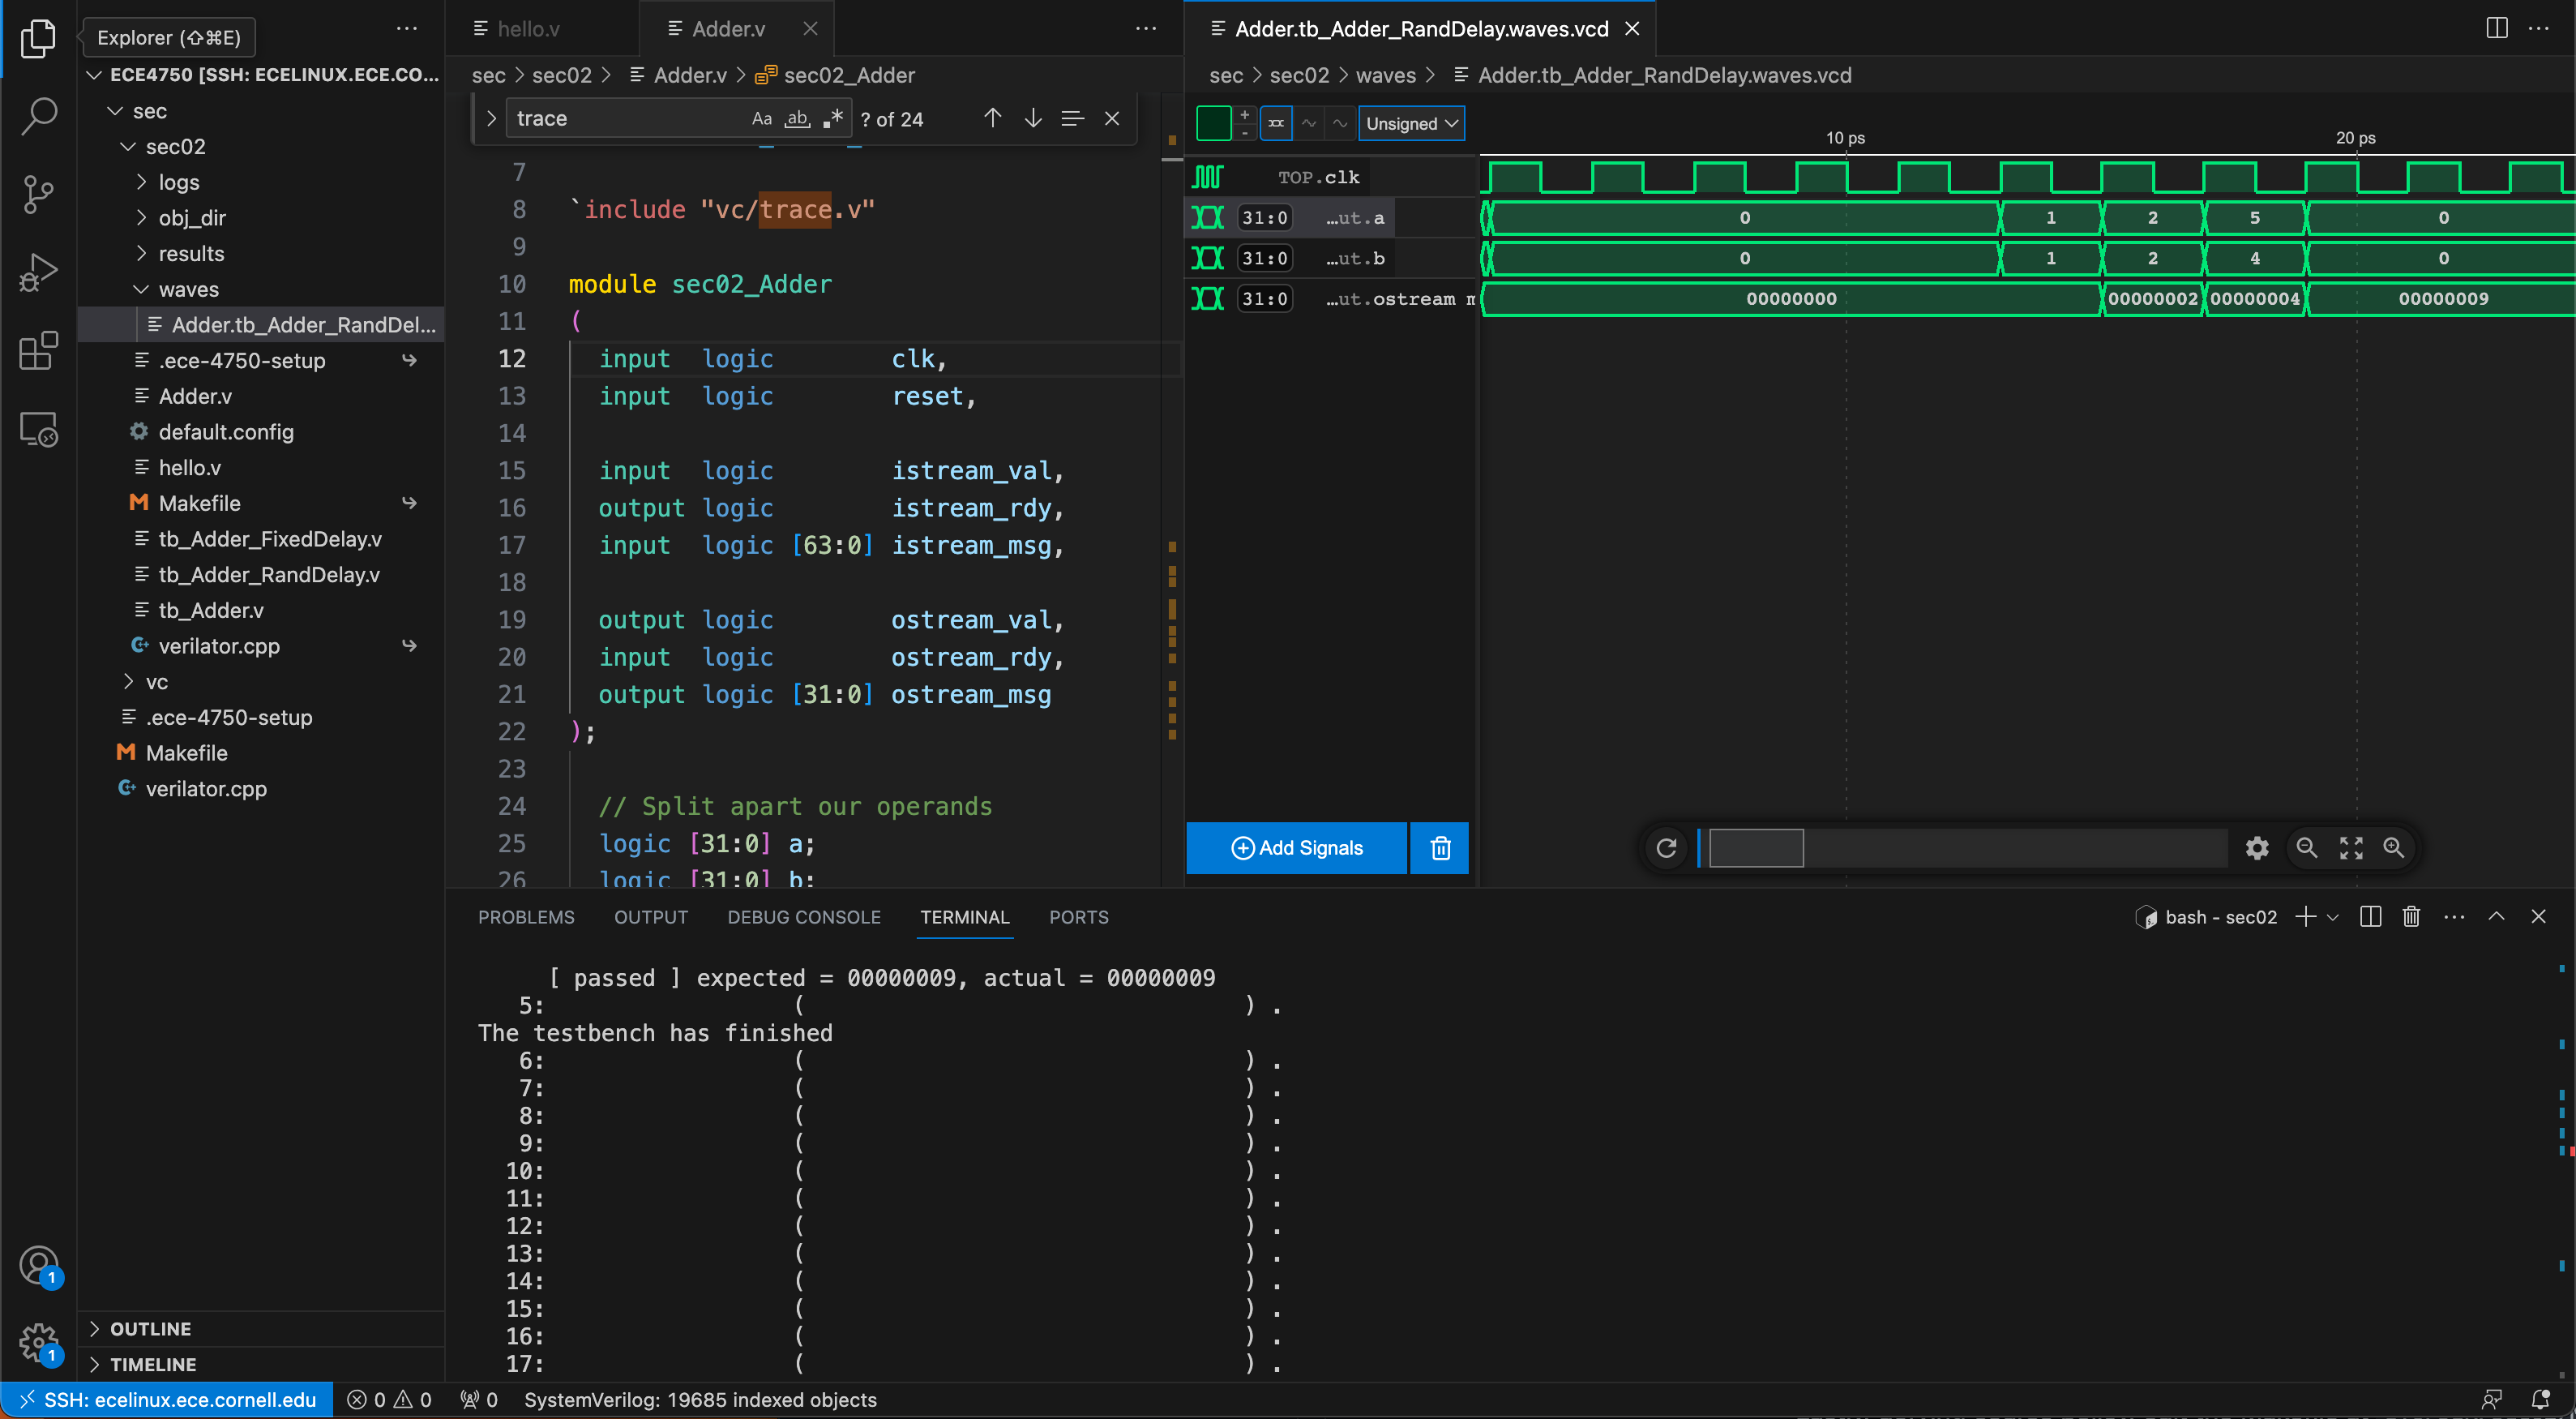
If you proceed to cleaning, regenerating, and running the testbench,
you will now find the VCD files in the waves folder. If you click
on any of them, the corresponding plug-in should launch. You should now
have a phenomenal 3-tile workflow set up! You can edit your Verilog
code, verilate, and debug it, all in the same window.
% make tb_Adder_RandDelay.v DESIGN=Adder RUN_ARG=--trace
Overview of Testing Strategies
Now let’s get back to testing the simple single-cycle adder we developed in last week’s discussion:

As a reminder, here is the interface for our latency-insensitive adder:
module sec02_Adder
(
 input  logic        clk,
 input  logic        reset,

 input  logic        istream_val,
 output logic        istream_rdy,
 input  logic [63:0] istream_msg,

 output logic        ostream_val,
 input  logic        ostream_rdy,
 output logic [31:0] ostream_msg
);
- Again, anyone care to explain how this works?
In tb_Adder.v we had set up the following sample test cases:
test_case( { 32'd1, 32'd1 },  32'd2 );
test_case( { 32'd2, 32'd2 },  32'd4 );
test_case( { 32'd4, 32'd5 },  32'd9 );
As a reminder, we can then run these tests as follows:
% cd $TOPDIR/sec02
% make tb_Adder_RandDelay.v DESIGN=Adder
Experiment with different input values. Try large values that result in overflow:
test_case( { 32'd1, 32'd1 },  32'd2 );
test_case( { 32'd2, 32'd2 },  32'd4 );
test_case( { 32'd4294967295, 32'd1 },  32'd4294967296 );
What we have been doing is a form of assertion testing where we explicitly define input vectors and expected outputs so that the testbench systematically determines whether any given test passes or fails. This is as opposed to ad-hoc testing, in which case we also specify the inputs, but then manually inspect the output (e.g. traces or waves) to determine whether they reflect the expected behavior. The latter approach is only truly feasible in the context of small modules, or as you know, for debugging, but as designs increase in complexity it is of the utmost importance that an automated testing process be in place. Being able to replicate the original testing strategy will save us a significant amount of time if we expect this design to be modified (by others) in the future.
To discuss in class: testing spectra
- Ad-Hoc vs. Assertion Testing
- Directed vs. Random Testing
- Black-Box vs. White-Box Testing
- Value vs. Delay Testing
- Unit vs. Integration Testing
- Reference Models
Generating Coverage Reports with gcov/lcov
To discuss in class:
- Drawing from your own experience with Lab 1, define “coverage.”
- Why is test coverage such a big deal?
In our Makefile, we have included a series of commands that will generate
coverage reports after your tests have been run. This last part is important
to stress, and in fact we recommend that you make clean and rerun the
tests you are interested in before proceeding with generating the report. Not
cleaning can result in stale and essentially incorrect reports. Also note that
coverage information will only be obtained if we pass a valid input to the
COVERAGE parameter. For our previous example, we would dump coverage information and
generate the report as follows:
% make clean
% make tb_Adder_RandDelay.v DESIGN=Adder RUN_ARG=--trace COVERAGE=coverage
% make coverage-report
Here, COVERAGE=coverage can be replaced with COVERAGE=coverage-line or
COVERAGE=coverage-toggle.
To review in class:
- What was the difference between line and toggle coverage?
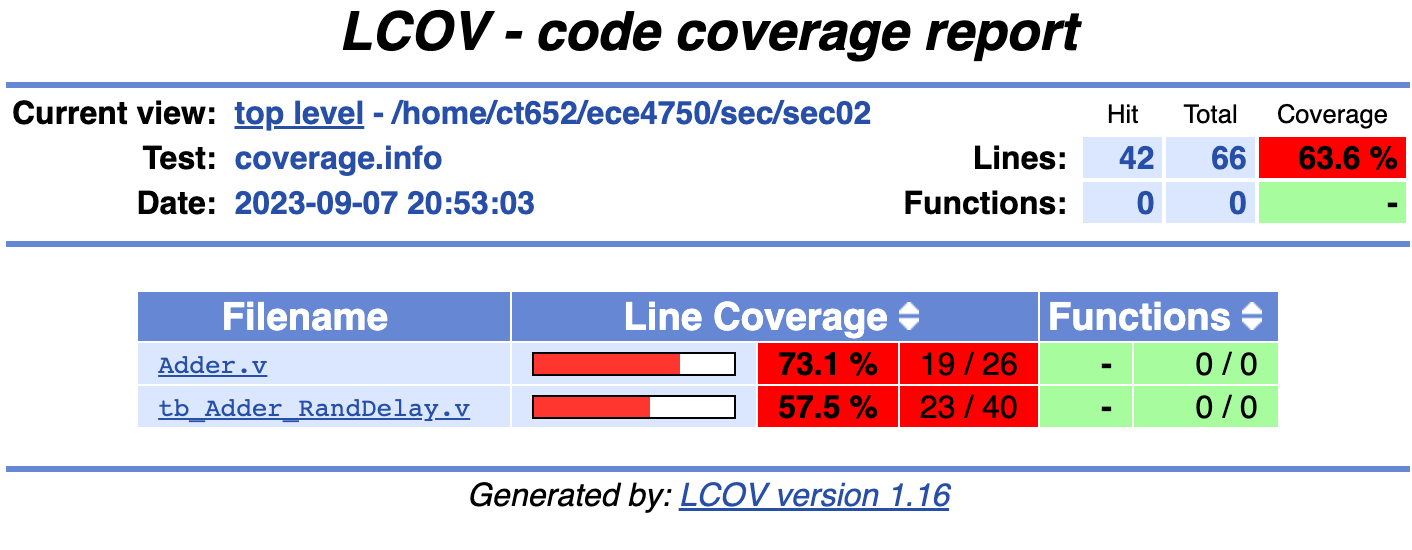
Running the aforementioned commands will populate your logs folder. Of particular
interest is the coverage subdirectory, which contains a report formatted in HTML.
You can simply download this folder with VSCode or MobaXterm by right-clicking on it
and selecting the appropriate option. This can then be opened with your web browser
of choice (e.g. Firefox.) Another option with VSCode is to make use of Microsoft’s
Live Preview plug-in.

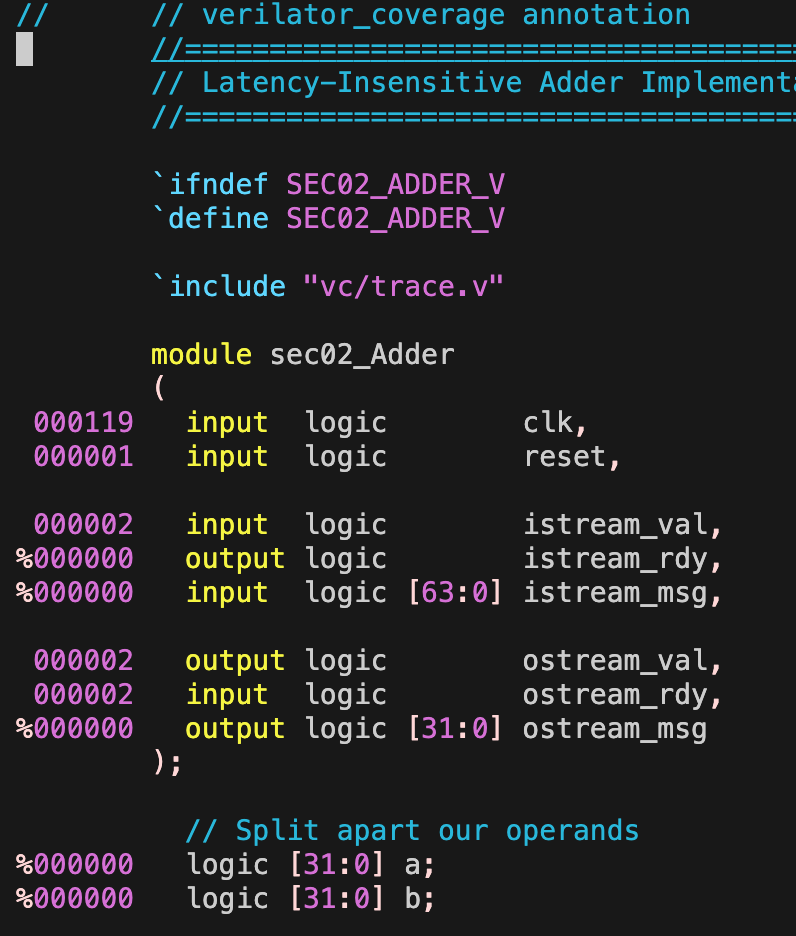
If you are not a fan of GUIs, you can always check the same information in the
annotated subdirectory, where you will find the original code with the same
information in the left margin. For example:
% cd $TOPDIR/sec02/logs/annotated
% vim Adder.v